Mastering Candlestick Patterns: The Secret Weapon of Successful Stock Traders
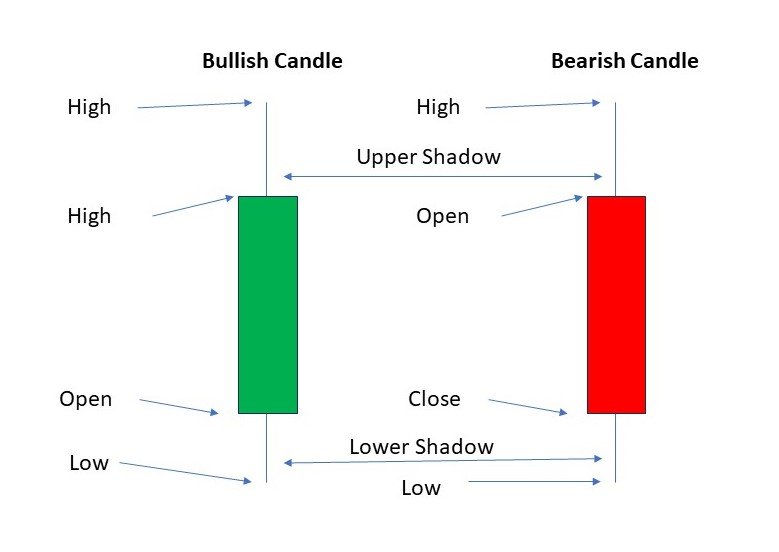
Candlestick patterns in the stock market reflect the activity of buyers and sellers in the market. These consist of candle-shaped figures on a chart, showing the opening, closing, and high, and low prices of a stock during a specific period of time. These patterns provide information about market sentiment and potential future trends, helping traders and investors make decisions.
Mastering Candlestick Patterns: The Secret Weapon of Successful Stock Traders Read More »

