In the dynamic world of stock trading, success often depends on the ability to interpret market trends effectively. An invaluable beneficial tool that can make all the difference is the understanding of candlestick patterns. Seeing into the minds of buyers and sellers in the market and accurately assessing market direction is what can make you adept at trading. These patterns, a visual representation of price movements, provide traders with important insights into market behavior. In this comprehensive guide, we will delve deeper into the art of mastering candlestick patterns, equipping you with the knowledge and skills to become a more successful trader.
Unveiling the Language of Candlesticks:
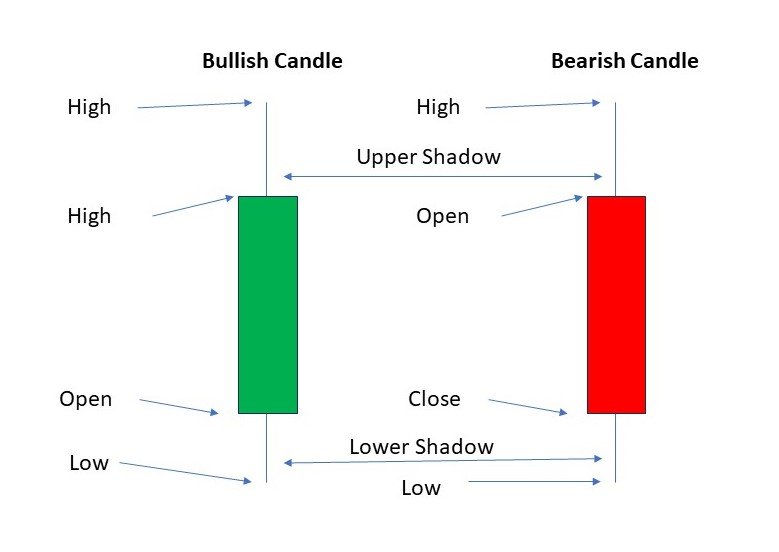
Before we dive into the intricacies of candlestick patterns, it’s essential to grasp their fundamental elements. Each candlestick consists of a body and wicks, representing the opening, closing, high, and low prices of a given time frame. Understanding these components is crucial in deciphering the story a candlestick tells.
The Bullish and Bearish Signals: Decoding Market Sentiment:
Before we delve into the intricacies of candlestick patterns, it is important to understand their basic elements. Each candlestick has a body and wicks, which represent the opening, closing, high and low prices of a certain time frame. Understanding these components is important to understand the story told by the candlestick.


- Opening Price: Candle-making starts with this part, known as the OPEN price.
- Closing Price: The candle closes in this position, closing at the last moment known as the CLOSE price.
- Highest Price: The candle represents the highest price in its period, known as the HIGH price.
- Lowest Price: The candle indicates the lowest price of its period, known as the LOW price.
The above-mentioned parts are present in every candle, whether it is a bullish candle, a bearish candle, or any other candle.
Building a Strong Foundation: Basic Candlestick Patterns:
Let’s start by exploring some of the main basic candlestick patterns that every trader should be familiar with:
1. Bullish:
Bullish candles are those in which the closing price is higher than the opening price. These are usually shown in green color.
2. Bearish:
Bearish candles are those in which the closing price is lower than the opening price. These are usually shown in red color.
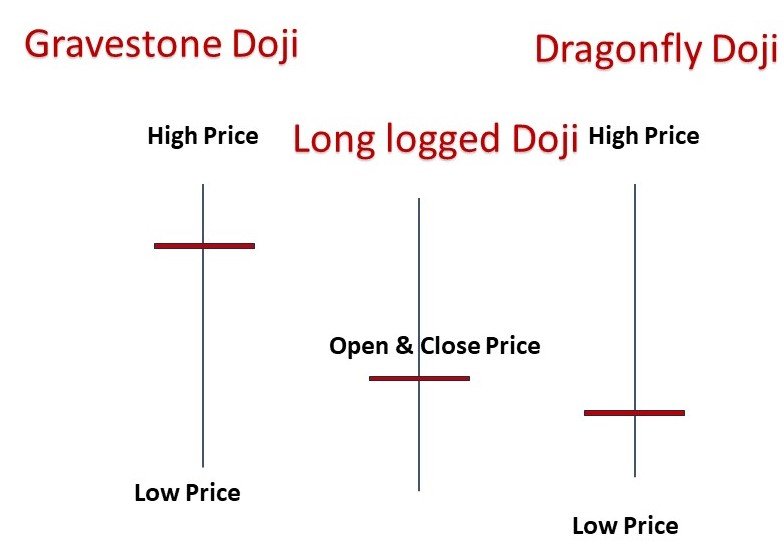
3. Doji
- A sign of market indecision, where the opening and closing prices are virtually the same.
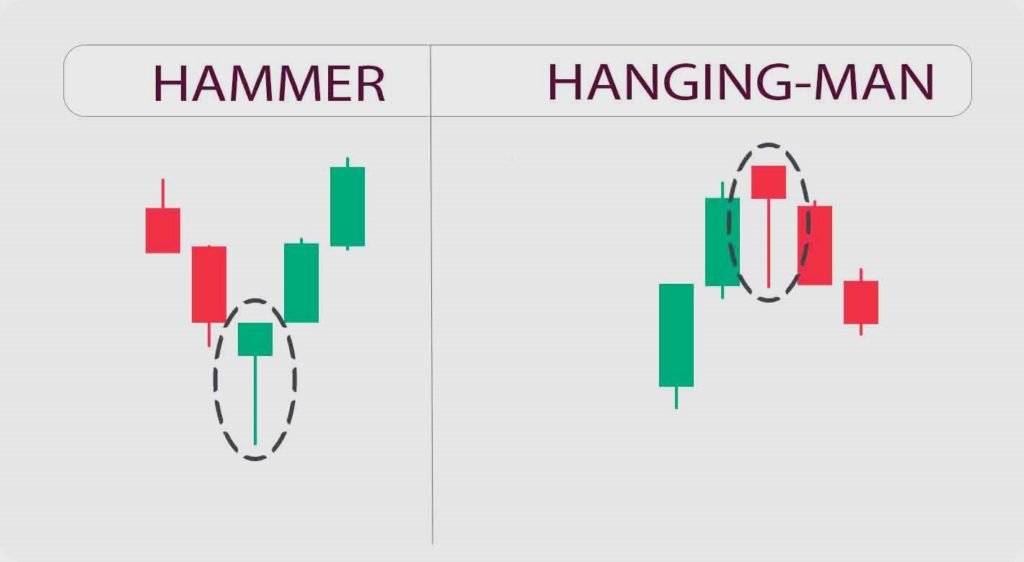
4. Hammer and Hanging Man
- These patterns suggest potential trend reversals, with the body representing the hammer or hangingman, and the wick indicating the price range.
5. Engulfing Patterns
- Comprising of bullish and bearish engulfing patterns, these indicate a shift in market momentum.
Advanced Strategies: Complex Candlestick Patterns:
Moving beyond the basics, advanced traders often incorporate more complex patterns into their strategies. These patterns involve combinations of multiple candlesticks, offering deeper insights into market behavior.
6. Three White Soldiers and Three Black Crows:
- These patterns consist of consecutive bullish or bearish candlesticks, indicating strong trends.
7. Evening and Morning Stars:
- Offering potential reversal signals, these patterns involve a series of three candlesticks.
Integrating Candlestick Patterns into Your Trading Strategy:
To truly harness the power of candlestick patterns, traders must integrate them into a comprehensive trading strategy. This involves considering factors such as trend analysis, support and resistance levels, and other technical indicators.
The Bottom Line: Empowering Traders for Success:
Mastering candlestick patterns is not merely about memorizing shapes; it’s about interpreting the language of the market. By incorporating these powerful tools into your trading arsenal, you gain a distinct advantage in the fast-paced world of stock trading. Stay vigilant, keep honing your skills, and let candlestick patterns be your secret weapon to achieving greater success in the stock market.
In conclusion, understanding and effectively utilizing candlestick patterns is a skill that sets successful traders from the rest. With their ability to provide critical insights into market behavior, these patterns serve as a secret weapon in any trader’s toolkit. By delving into the nuances of candlestick analysis, you equip yourself with the knowledge needed to navigate the complexities of the stock market with confidence and precision. So, embark on this journey of mastery, and let candlestick patterns be your guiding light to trading success.


