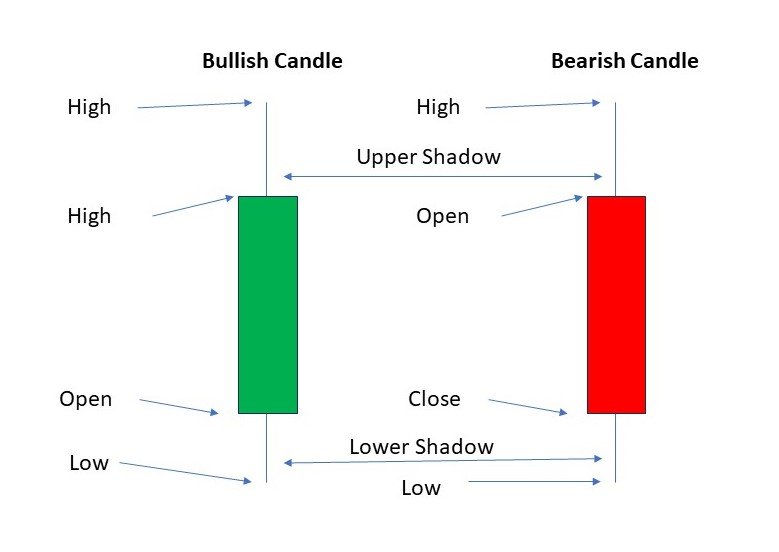
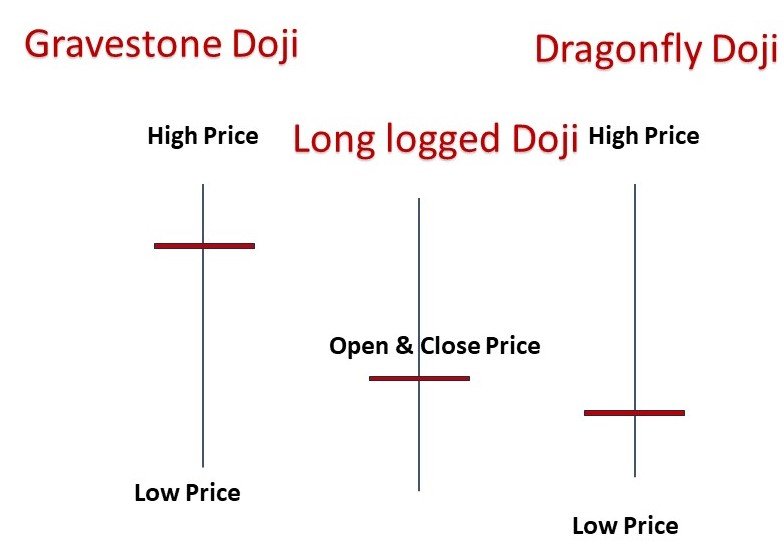
Hammer and Hanging Man
Instructions:
Welcome, investors and traders, to our informative blog post where we delve into the fascinating world of stock market analysis. Today, we aim to demystify two key candlestick patterns – the Hammer and Hanging Man – that hold the potential to unlock hidden profits in your trading endeavors. With a formal and data-driven approach, we will explore the intricacies of these patterns, equipping you with valuable knowledge to navigate the ever-changing landscape of the stock market. So, let’s dive in and unravel the secrets behind Hammer and Hanging Man candlesticks, empowering you to make informed investment decisions.
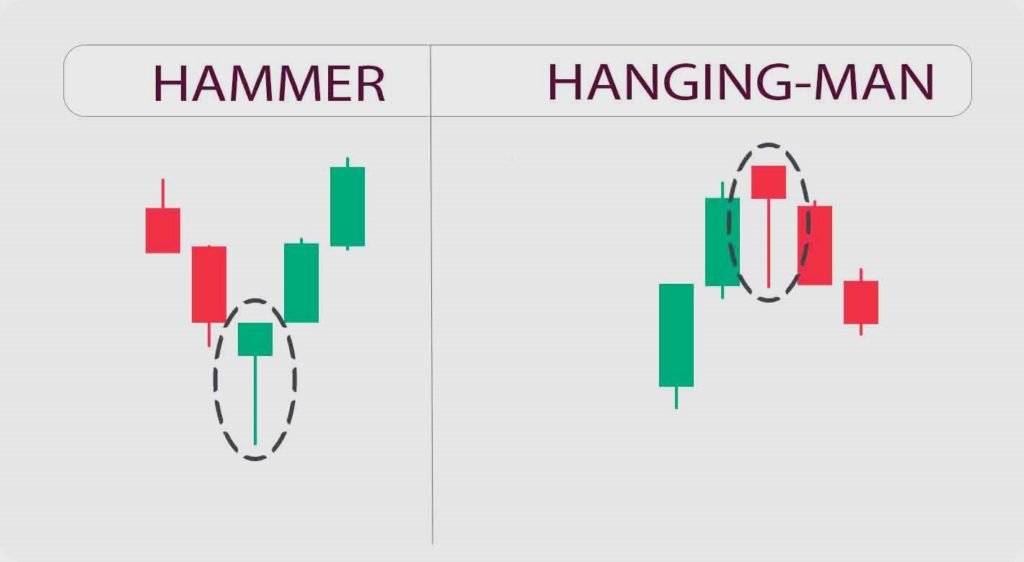

Definition of Candlestick Patterns
Candlestick patterns are visual representations of price movements in financial share price charts. They are formed by the arrangement of individual candlesticks, each representing a specific time period (such as a day or an hour). These patterns provide insights into the market sentiment and can help predict future price movements in a specific time period. Some common candlestick patterns include doji, hammer, engulfing, shooting star, and spinning top. Investors, Traders, and analysts use these patterns to make informed decisions and identify potential trading opportunities.
Table of Contents
Overview of Hammer and Hanging Man Patterns
The Hammer and Hanging Man are candlestick patterns used in technical analysis to identify potential reversals in price trends. Here’s a brief overview:
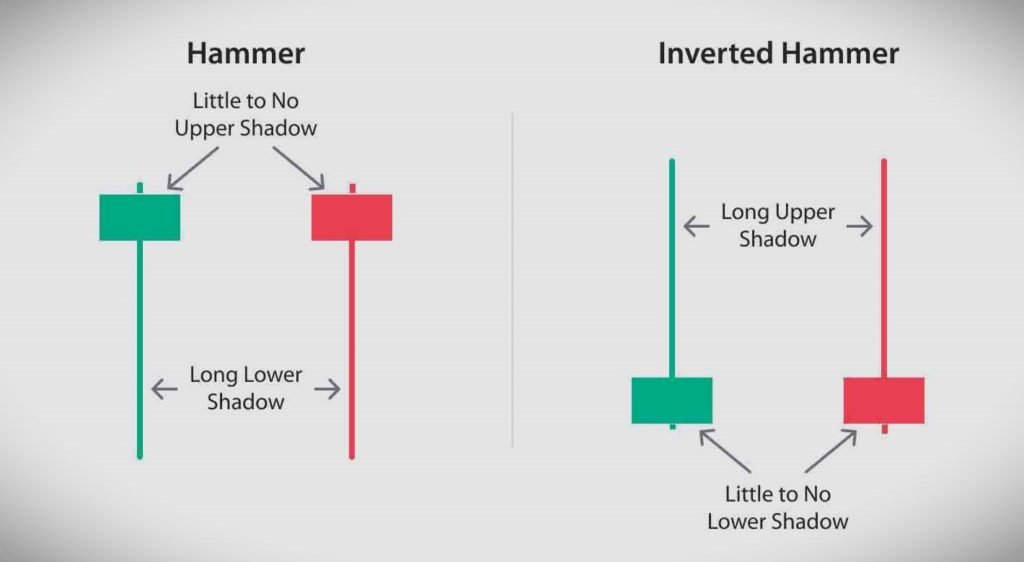

Hammer Pattern:
The Hammer pattern is a bullish reversal signal that occurs during a downtrend. It consists of a small body near the top of the candlestick and a long lower wick. The lower wick should be at least twice the length of the body. This pattern suggests that selling pressure has exhausted, and buyers may be stepping in, potentially leading to a trend reversal.Hanging Man Pattern:
The Hanging Man pattern is a bearish reversal signal that occurs during an uptrend. It has a similar structure to the Hammer pattern, with a small body near the bottom of the candlestick and a long upper wick. The upper wick should be at least twice the length of the body. This pattern indicates potential selling pressure and a possible trend reversal.
Remember that candlestick patterns should be used in conjunction with other technical analysis tools and indicators to make informed trading decisions.
Understanding the Hammer Candlestick Pattern
The hammer candlestick pattern is a bullish reversal pattern that often appears at the bottom of a downtrend. It consists of a small body located at the upper end of the trading range and a long lower shadow. The hammer pattern indicates that sellers were initially in control but were then overwhelmed by buyers, suggesting a potential trend reversal.
Interpreting the Hammer Pattern
The Hammer pattern is a bullish reversal candlestick pattern that can indicate a potential trend reversal from a downtrend to an uptrend. It is characterized by a small body near the top of the candlestick with a long lower shadow and little to no upper shadow.
The interpretation of the Hammer pattern is as follows:
- The small body near the top of the candlestick represents a small trading range between the opening and closing prices.
- The long lower shadow indicates that sellers pushed the price lower during the trading session but lost control, and buyers were able to push the price back up.
- The absence or minimal upper shadow suggests that buyers were able to maintain control and prevent the price from falling further.
Overall, the Hammer pattern suggests that buying pressure is increasing and that a potential trend reversal or price bounce may occur. However, it is important to consider other technical indicators and confirmatory signals before making trading decisions based solely on the Hammer pattern.
Significance in Chart Analysis
Chart analysis is a technique used in technical analysis to study and interpret patterns and trends in financial markets. It helps traders and investors make informed decisions by analyzing historical price and volume data. The significance of chart analysis lies in its ability to identify potential entry and exit points, determine support and resistance levels, and generate trading signals. By analyzing charts, traders can gain insights into market sentiment, identify potential reversals or breakouts, and assess the strength of trends. This analysis can be applied to various financial instruments such as stocks, commodities, and currencies.
Decoding the Hanging Man Candlestick Pattern
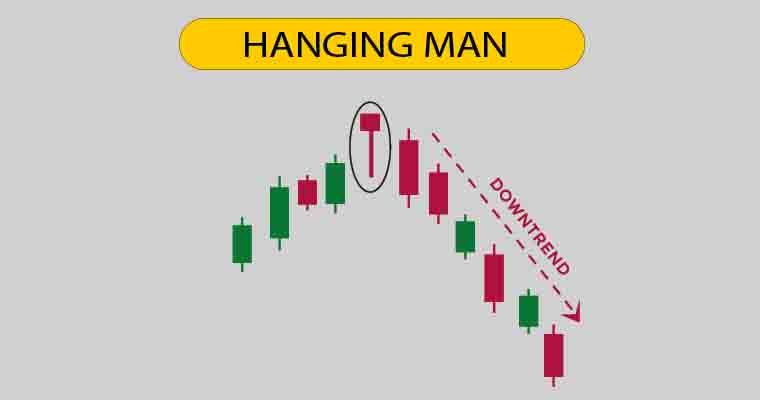

The Hanging Man is a bearish candlestick pattern that forms at the end of an uptrend. It indicates a potential reversal in the market. Here is the description and interpretation of the Hanging Man pattern:
Description:
- The Hanging Man pattern consists of a single candlestick.
- It has a small body located near the lower end of the trading range.
- The lower shadow (also called the tail) is at least twice the length of the body.
- The upper shadow is very small or nonexistent.
Interpretation:
- The Hanging Man suggests that buyers were initially in control but lost momentum, allowing sellers to push the price down.
- It indicates a potential shift from an uptrend to a downtrend.
- Confirmation is needed to validate the pattern, such as a bearish candlestick or a gap-down opening in the next session.
- Traders often use other technical indicators or supporting patterns to make trading decisions based on the Hanging Man.
Remember, candlestick patterns should not be used in isolation but as part of a comprehensive analysis.
Analyzing the Hanging Man Pattern
The Hanging Man pattern is a bearish candlestick pattern that can indicate a potential reversal in an uptrend. It consists of a small body and a long lower shadow, with little to no upper shadow. The pattern suggests that sellers are gaining control and that there may be a shift in sentiment from bullish to bearish. Traders often interpret the Hanging Man pattern as a signal to consider selling or taking profits. However, it is important to analyze the pattern in the context of the overall market conditions and consider other indicators before making any trading decisions.
Importance in Stock Market Analysis
Stock market analysis is crucial for investors and traders to make informed decisions about buying, selling, or holding stocks. By analyzing stock market data, investors can gain insights into the performance and prospects of individual companies, industries, and the overall market. Here are some key reasons why stock market analysis is important:
Identifying investment opportunities: Analysis helps investors identify undervalued stocks with the potential for growth, allowing them to capitalize on investment opportunities.
Risk management: By analyzing market trends, financial statements, and other relevant data, investors can assess the risk associated with a particular stock or portfolio. This helps mitigate potential losses and make more informed investment decisions.
Timing of investments: Analysis helps investors determine the optimal time to buy or sell stocks. By identifying market trends, price patterns, and technical indicators, investors can improve their chances of buying low and selling high.
Understanding company performance: Stock market analysis provides insights into a company’s financial health, growth prospects, competitive position, and industry trends. This information is vital for investors to understand a company’s potential for success and make informed investment decisions.
Portfolio diversification: Analysis helps investors diversify their portfolios by identifying stocks from different sectors or industries. Diversification helps reduce the risk of significant losses and provides the potential for better returns.
Monitoring investments: Regular analysis helps investors monitor the performance of their investments and identify any changes in market conditions that may impact their portfolio. This allows for proactive decision-making and adjustments to investment strategies.
In summary, stock market analysis is essential for investors to make informed investment decisions, manage risk, identify opportunities, and monitor the performance of their investments.
Summary of Hammer and Hanging Man Patterns
The Hammer and Hanging Man patterns are candlestick patterns used in technical analysis to identify potential reversals in a trend. Here’s a summary of these two patterns:
- Hammer Pattern:
- A Hammer pattern is a bullish reversal pattern that forms at the end of a downtrend.
- Characteristics:
- The candle has a small body near the top end of the overall range.
- The lower shadow (tail) is at least twice the size of the body.
- There is little to no upper shadow.
- Interpretation:
- The Hammer pattern suggests that selling pressure is weakening and buyers may be entering the market.
- It indicates a potential trend reversal from bearish to bullish.
- Hanging Man Pattern:
- A Hanging Man pattern is a bearish reversal pattern that forms at the end of an uptrend.
- Characteristics:
- The candle has a small body near the bottom end of the overall range.
- The upper shadow (tail) is at least twice the size of the body.
- There is little to no lower shadow.
- Interpretation:
- The Hanging Man pattern suggests that buying pressure is weakening and sellers may be entering the market.
- It indicates a potential trend reversal from bullish to bearish.
Remember, it’s important to consider these patterns in the context of the overall market trend and use them in conjunction with other technical indicators for confirmation before making any trading decisions.

