Fibonacci Sequence: Unraveling its Power Application in the Stock Market
Introduction
The Fibonacci sequence, a mathematical concept that dates back to ancient times, holds significant importance in various fields, including finance and the stock market. In this article, we will delve into the intricacies of the Fibonacci sequence, its definition, and how it functions as a crucial tool in the stock market.
Table of Contents
Understanding the Power of Fibonacci Sequence
What is the Fibonacci Sequence?
The Fibonacci sequence is a series of numbers where each number is the sum of the two preceding ones. It starts with 0 and 1, and the subsequent numbers in the sequence are derived by adding the two numbers that precede them.
Example Like: 0, 1, 1, 2, 3, 5, 8,13, 21, 34, 55, 89, ……….to the Infinite.


The Sequence Unraveled
- The Beginning Numbers: The Fibonacci sequence commences with the numbers 0 and 1.
- Calculating the Next Numbers: To generate subsequent numbers, you add the last two numbers in the sequence.
- Continued Iteration: This process is repeated, resulting in a sequence that unfolds as 0, 1, 1, 2, 3, 5, 8, 13, and so on.
Fibonacci Sequence in the Stock Market
Application in Technical Analysis
The Fibonacci sequence plays a pivotal role in technical analysis, aiding traders in making informed decisions regarding market trends and potential price movements.


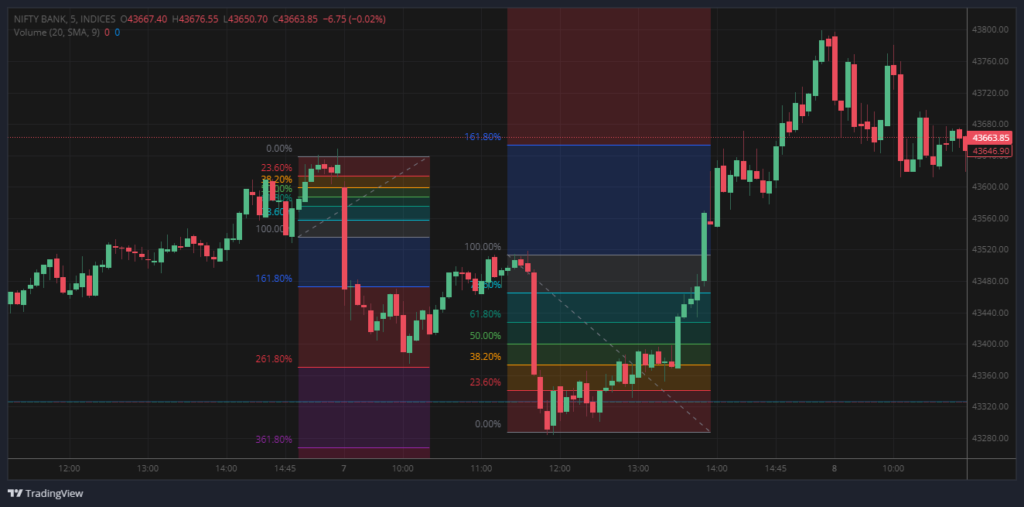
For the example, According to above image In the context of Bank Nifty, Fibonacci-power involves identifying key retracement levels (e.g., 23.6%, 38.2%, 50%, 61.8%, and 78.6%) based on previous price trends. These levels are considered potential support and resistance points for the stock price.
Fibonacci Retracement Levels
- Defining Fibonacci Retracement: It is a technique used to identify potential support and resistance levels based on the Fibonacci numbers before the price continues in the original direction.
- Key Retracement Levels: The most commonly used retracement levels are 38.2%, 50%, and 61.8%.
Fibonacci Extensions
- Extending the Analysis: Fibonacci extensions are used to predict potential future price levels beyond the original trend.
- Levels to Watch: The primary extension levels are 138.2%, 150%, and 161.8%.
How the Fibonacci Sequence Influences Stock Market Trends
The Fibonacci sequence is intertwined with human psychology and trading behavior, affecting market trends and price movements.
Integrating Fibonacci Tools in Trading Strategies
Traders employ various Fibonacci tools, including retracement levels and extensions, to make informed decisions and mitigate risks.
Practical Examples
Let’s explore a practical scenario to illustrate how the Fibonacci sequence is applied in stock market analysis.
Conclusion
In conclusion, the Fibonacci sequence is a powerful tool in the stock market, aiding traders in making informed decisions based on historical price movements. Understanding its application in technical analysis, particularly through retracement levels and extensions, empowers traders to navigate the dynamic world of stock trading.
To learn about candlestick patterns, and achieve more sharpness in your trading skills Please click here.
FAQs
- What is the significance of the Fibonacci sequence in the stock market?
The Fibonacci sequence helps traders identify potential support and resistance levels, making it a valuable tool in technical analysis. - How do Fibonacci retracement levels work?
Fibonacci retracement levels identify potential price levels where an asset may find support or resistance before continuing in its original direction. - What are Fibonacci extensions and how are they used in trading?
Fibonacci extensions are used to predict potential future price levels beyond the original trend, providing traders with insights for setting profit targets. - Are there other mathematical concepts used in stock market analysis?
Yes, there are various mathematical concepts like moving averages, trendlines, and statistical indicators that complement the use of Fibonacci sequences. - Where can I learn more about implementing Fibonacci tools in my trading strategy?
You can explore specialized courses and resources dedicated to technical analysis and Fibonacci tools to enhance your trading skills.


