Candlestick

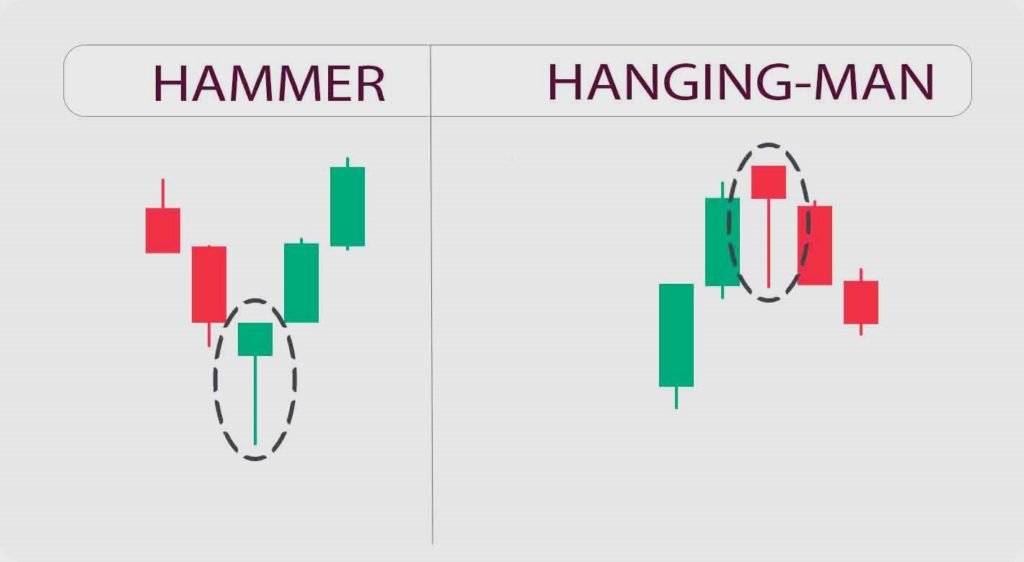
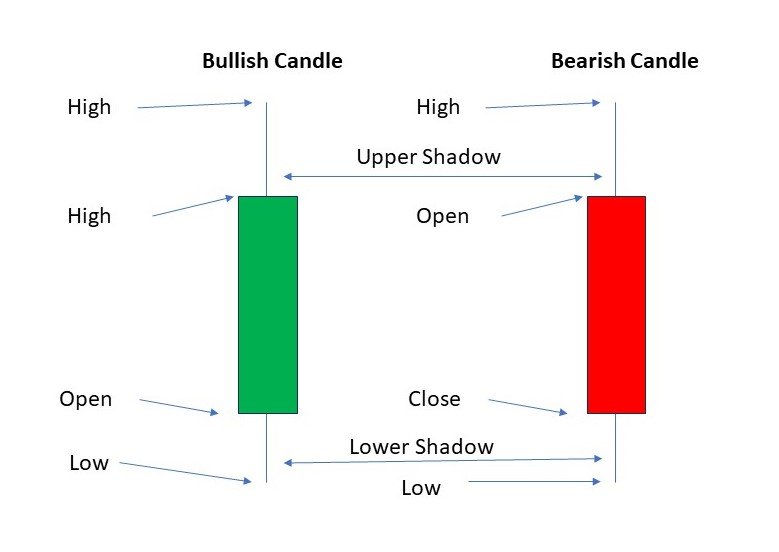
A candlestick in the stock market refers to a visual representation of price movements for a specific period, usually a day, hour, or minute. It consists of a rectangular “body” and a “wick” or “shade” extending from each end.
The main part represents the opening and closing prices, with different colors indicating profit (green) or loss (red).
The Vicks reflect the highest and lowest prices reached during this period. Candlestick charts are widely used by traders and analysts to analyze price trends and make informed decisions about buying or selling assets. They provide valuable insight into market sentiment and help identify potential turning points or trends in stock prices.

scalping a Scalper

Mastering Scalping Trading Strategy: A Guide for Successful Scalpers 2024

Explore the art of scalping trading strategy in our comprehensive guide. Learn how to navigate the fast-paced world of trading, make precise decisions, and achieve success as a proficient scalper. Whether you’re an experienced trader or just starting out, this guide will equip you with the skills and knowledge needed to master the scalping strategy and excel in the dynamic world of trading

Mastering Scalping Trading Strategy: A Guide for Successful Scalpers 2024 Read More »

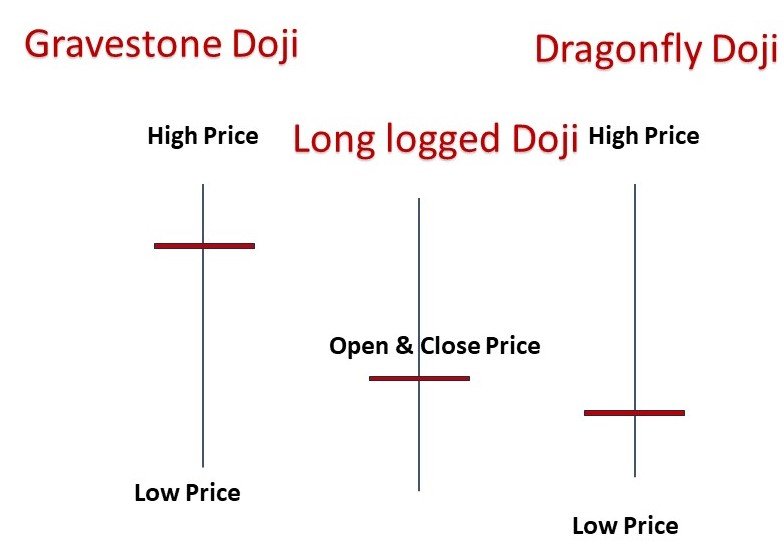
Doji candles

Decode 4 Doji Candles: Your Success to Profits in the Stock Market

Introduction If you understanding the intricacies of the Doji candlestick pattern can certainly be the key to unlocking profitable opportunities in the fast-paced world of stock trading. Doji candle holds a special place among these patterns. Its unique structure and interpretation can provide valuable insight into market sentiment. In this comprehensive guide, we will delve

Decode 4 Doji Candles: Your Success to Profits in the Stock Market Read More »

Candlestick Patterns

Mastering Candlestick Patterns: The Secret Weapon of Successful Stock Traders

Candlestick patterns in the stock market reflect the activity of buyers and sellers in the market. These consist of candle-shaped figures on a chart, showing the opening, closing, and high, and low prices of a stock during a specific period of time. These patterns provide information about market sentiment and potential future trends, helping traders and investors make decisions.

Mastering Candlestick Patterns: The Secret Weapon of Successful Stock Traders Read More »

Scroll to Top